Blog - Hướng dẫn, Training Data
Journey to complete first transformation job
This blog aims to help a new data analyst adapt quickly to a transformation job.
1. ELT: Extract-Load-Transform
First, to understand what needs and does not need to be done in a transformation job, one must first understand the big picture of how data works and the role of the data analyst in this process in relation to other stakeholders.
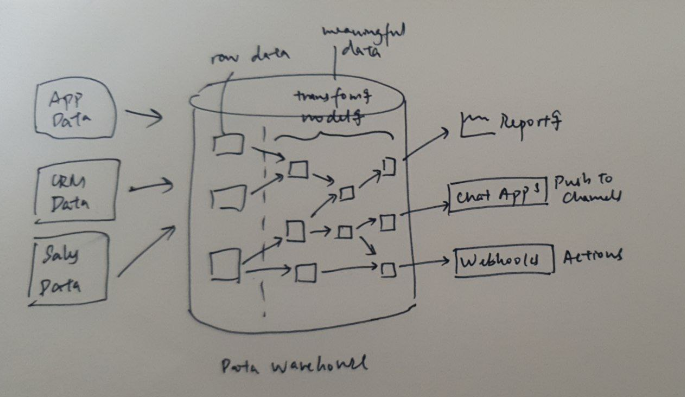
Figure 1: ELT process
When data is being processed, it means that data is extracted, loaded and transformed. This means data is extracted from one source and loaded into another and changes its form when it is transformed. In Vatico, data is loaded before being transformed. Read here for more context on why we shifted from ETL to ELT.
It is important to understand, specify and think of the data process in terms of these keywords as it will help give a more precise idea on how data moves and your position as a new data analyst in these workflows. For instance, after understanding the general operational workflows, you will need to understand the underlying data layer and mechanisms. Understanding the data process in terms of ELT helps guide you when you begin to question where and how data behaves behind these operational workflows. Read here for more as an example in the context of order fulfillment workflows and how ELT is integrated in the workflows.
Another task in Vatico is that you might also be asked to automate certain processes. What is automation exactly? Applying your understanding of data as extract-load-transform will help you understand that automation happens as a process of ELT and is a result of ELT.
2. Understanding your role as a data analyst in ELT
From a general standpoint, E/L will be carried out by the Data Engineer while T is the primary job scope of the Data Analyst.
In summary, understanding the big picture allows you to be clear of your position and understand what and why you are doing what you are doing. One of the tasks includes data transformation tasks.
3. What is T?
Transformation tasks generally uses business logic to transform raw data to reporting data. It is important to understand business and operational flows before transforming any data. Transformation tasks includes a broad range of tasks to serve different purposes such as to filter, standardize or aggregate data.
How do you approach a transformation task?
The key steps to a transformation task is to follow the process from ticket → wireframe → yml → sql script. The general rule of thumb is to plan thoroughly at each step and follow in a sequential order.
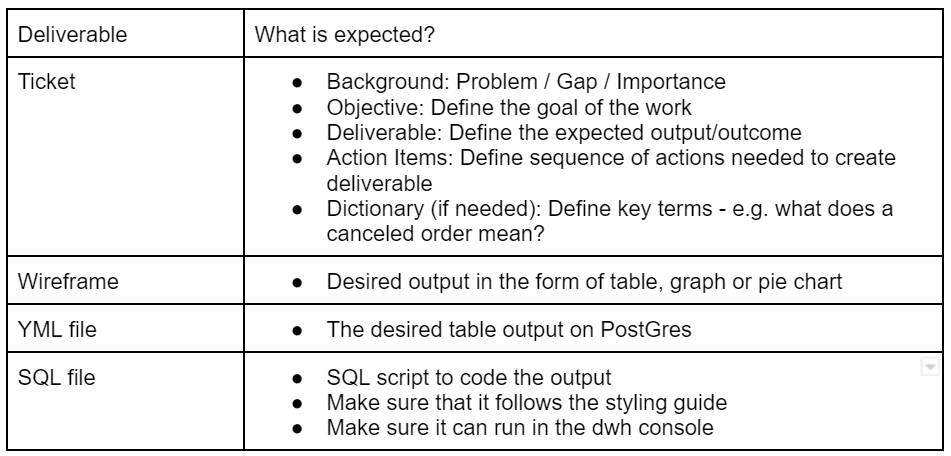
Figure 2: Summary of deliverables for transformation task
3.1 Ticket
A ticket of a task normally contains the background, objective, deliverable and action items of a task.
What to do when faced with blocker?
- A common blocker might be not understanding the purpose of the ticket or what is required of you to do.
- First, understand the workflows and the big picture of why you are doing the task is important.
- Then, return to the problem solving framework.
- Define your expectation and reality and follow the issue tree.
- Then, break down and write down additional in between steps for your personal understanding if you need to so the task is more manageable.
This step should not take more than 30 minutes.
3.2 Wireframing
What is a wireframe?
Wireframing is drawing out the expected output of what the table should look like. The table should contain the information and columns you need to obtain and answer the issue you are trying to solve in the ticket. If you are unable to visualize the end point and the output in mind, you will be unable to write the subsequent yml and sql required for the tasks.
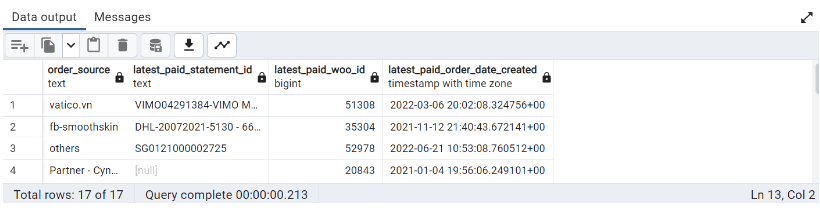
Figure 3: For example, having this image in your mind and being able to draw it out
How do you know what the table looks like?
To answer this, there is a need to recognise that there are different types of tables for different purposes. Is the expected output a table output from a query or a chart on a dashboard? Recognise the purpose of the table, identify the columns of information and visualize what information is needed. Then, one will be able to identify what is and is not a wireframe for the purpose of the task.
Example:
Context
Payment data is currently being manually logged. Automating the payment data from various marketplace channels like Lazada and Tiki allows for faster financial reconsolidation. The manual process of logging payment data has stopped since a few months before and there is a lag in payment records reconsolidated. However, we do not know the latest statement id that contains the last payment record that has been manually marked as paid. This can be done manually, however the process also needs to be maintained by the system. Hence, we need to retrieve the latest statement id by order source from the orders and payments table.
Initial drafts
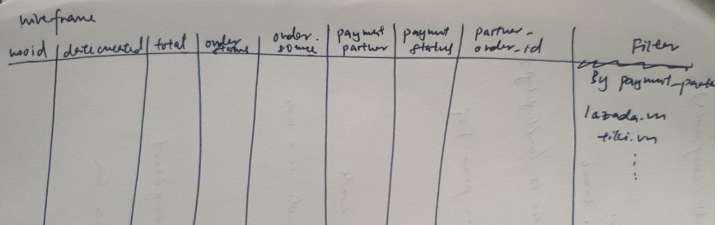
Figure 4: First draft of wireframe
- What was drawn here: following the format for CRM and adding new relevant columns.
- What went wrong: This is raw data (data dump) and is not a wireframe. Not all columns are relevant to what is needed to find.
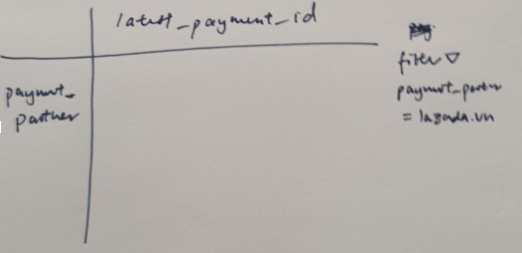
Figure 5: Second draft of wireframe
- What was drawn here: a diagram for a dashboard was created as a wireframe
- What went wrong: A diagram on a dashboard is not what was needed. There is no need for a filter. This is not the specific wireframe required for the task.
Finalized wireframe
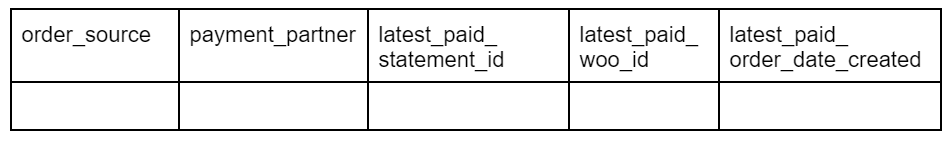
Figure 6: Aligned wireframe after iteration
- Column 1: order_source
- Column 2: payment_partner
- Column 3: latest_paid_statement_id
- Column 4: latest_paid_woo_id
- Column 5: latest_paid_order_date_created
General guidelines for drawing wireframes
Generally, a table for query output has two types of columns – dimension and measure value. Each dimension and measure value should have their own columns (read below for dimension and measure values). The data in the columns of the table identified should answer and solve the objective as identified in the ticket. If it does not, the wireframe is not effective.
Next, naming is important. Use precise and simple English to define the field you need. The title of the column should encapsulate the data the column represents and be understandable from a business, non-technical perspective.
At this step, it takes about 15 to 30 minutes to align what the wireframe and expected output should look like. Make sure that the wireframe is planned well before moving onto the steps below.
3.3 YML
What is a YML file?
YML serves as a machine readable docs of a report table (created by SQL).
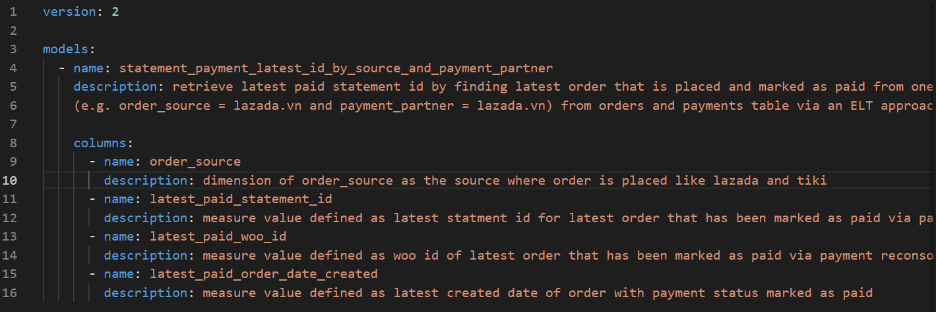
Figure 7: Example of a YML file
It shows an overview of data of the table name, description, table creator, column and its description. The description should use business language and tell the meaning of each table and column. Give examples in the description and specify what you would want to see under the column if it helps make the meaning of the column clearer.
It is crucial to define and state clearly the dimensions and measure values in the table before implementation. It allows us to begin with an end in mind and know exactly what is our desired output.
Guidelines for creating YML
To create a new YML, just download from a sample YML file on git and edit your content accordingly. You can edit and save your file as a YML on any text editor like Sublime or Visual Studio Code (similar to how you would save your files as pdfs). Make sure to maintain the strict indentation structure (since this is meant to be machine readable).
The YML file and the SQL file should also have the same name. It should be as concise as possible and fully encapsulate the data analysis you are doing.
Writing a YML takes typically an hour.
3.4 SQL Script
After drawing up the wireframing and writing the YML file, we can now proceed to writing the SQL script.
Steps to writing code
- Write code
- Clean up code based on SQL style guide
- Once code is clean and written, prioritize comparing code to wireframe/expected output
- Run code
Make sure code is clean before moving on. If code is unclean, it makes it hard to debug if there are any errors later on. Under step 3, compare code to wireframe by looking for five seconds if it is planned in YML and wireframe. For example, whether it is the number of columns or the number of columns or the same ids you want to obtain.
When faced with error when running code:
- Check if code is clean → If code not clean return to step 1 (clean code)
- Return to problem solving framework and follow issue tree
- Update expectations and deliverables in ticket if necessary
- Revise basic SQL queries (WHERE, SELECT, CASE, JOIN, GROUP BY, WITH, WINDOW FUNCTION, DATETIME)
Example of error faced:
From wireframe, there is a missing column payment_partner as it is found that there is no field to match to it.
Solve problem using problem solving framework
- Context: need to find latest statement payment id from partner, defined payment partner as partner with payment on platform
- Expectation: to find payment_partner field in payments table
- Reality: field for payment_partner does not exist in payments table, there is only clean data for order_source
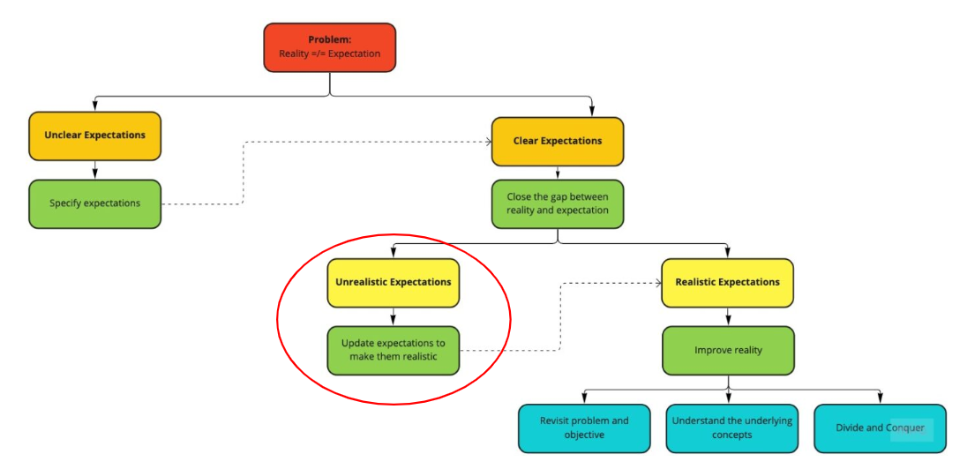
Figure 8: Issue tree from Problem Solving Framework
- Unrealistic expectation: payment_partner is not needed since there is already order_source which identifies where the order is made
- Update and revisit expectation: Drop 1 column of payment_partner from deliverable
- Update YML and SQL query
3.5 Dimension and measure values
Definitions of dimension and measure values
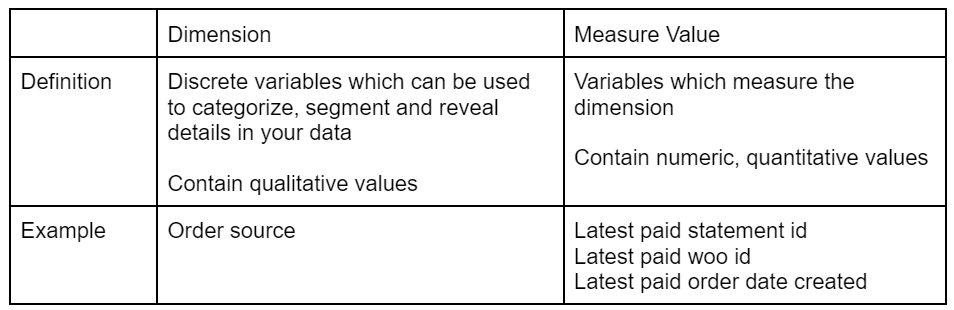
Figure 9: Definition of dimension and measure values
Example: Understanding dimension and measure values
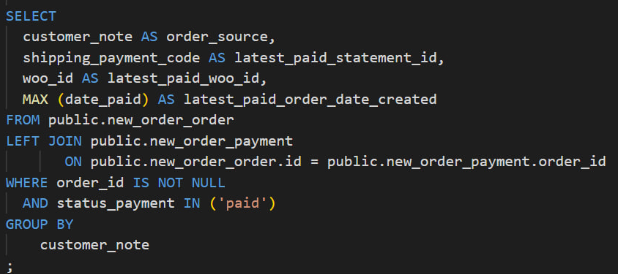
Figure 10: Missing functions required in measure values
As defined in the YML file in Figure 7, columns for latest paid statement id (2), latest paid woo id (3) and latest paid order date created (4) are defined as measure values that measure the dimension of order source.
However, from Figure 8, only column 4 has a function (MAX). Columns 2 and 3 have no function. Hence, columns 2 and 3 are just retrieving corresponding fields to column 4 and are behaving like a dimension. However, this was not what was required in the YML file.
Measure values must have a function in aggregation. This is where transformation occurs. If there is no function, there is no transformation happening.
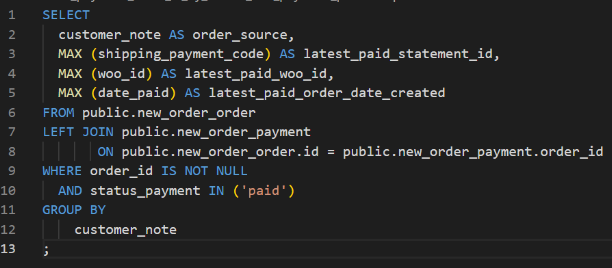
Figure 11: All required functions present in measure values
Here, columns 2, 3 and 4 have aggregate functions and are thus measure values of the dimension order source.
Can a measure value be a dimension?
Data is relative. For example, in a raw table, if we do one aggregation table to form a new report table but then used this new report to create another report, then the original report becomes raw data. This is the same for dimension and measure values. If we obtain a measure value but transform the measure value into a category for another creation of table, it can then be used as a dimension.
4. General tips on transformation task
- Make sure your thought process is clear. When your thought process is clear, your code will be clear.
- Don’t scramble your thoughts around (especially when you are faced with a blocker).
- Make sure everything is planned and sequential so you can solve the problem step by step
- Make it right at each step before heading forward
- Return to problem solving framework when in difficulty
- Order columns in reporting table from left to right according to level of importance from highest to lowest