

Training Data
Part 1: How Our Data Warehouse Used to Work — and Why We Needed to Change
1
The Old Layer
(You are here)
(You are here)
2
The New Layer
(Part 2)
(Part 2)
If you are reading this on your first or second week, welcome. Before we talk about how our data warehouse works today (28 July 2026), it helps to understand how it worked before — and more importantly, why that was a problem worth fixing. This post is Part 1. No heavy technical knowledge required.
What Is a Data Layer — and How Our Old Architecture Worked
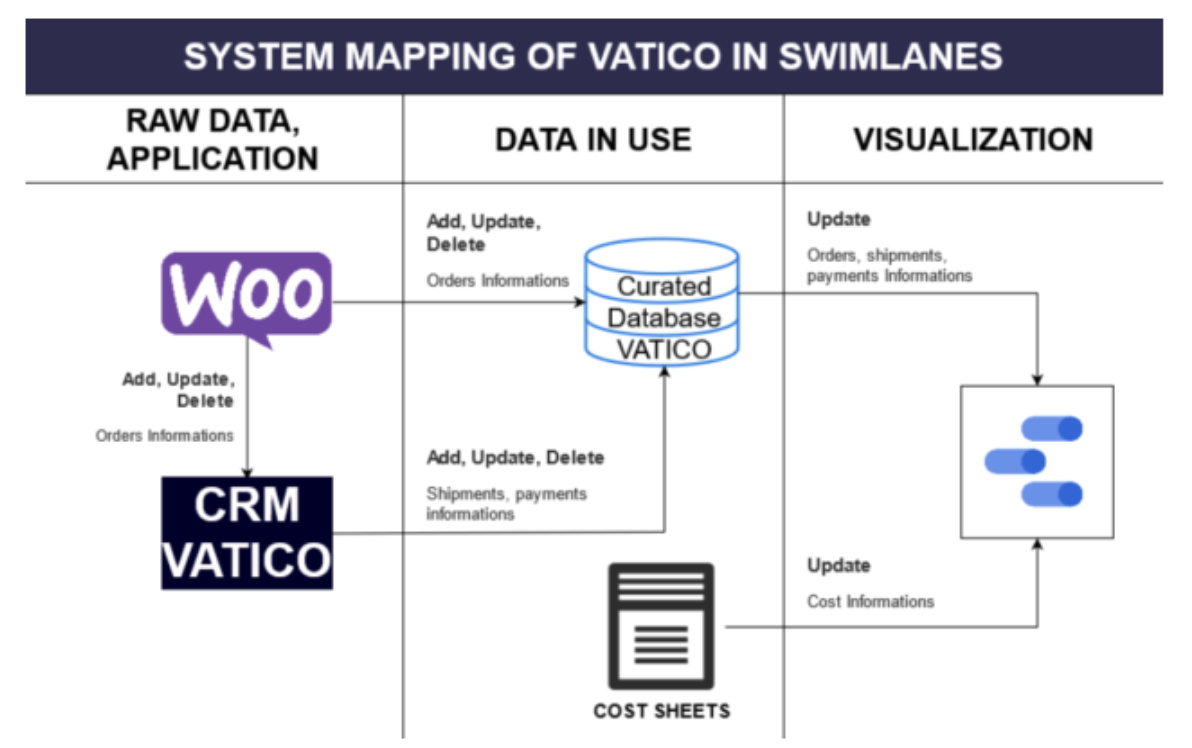
Vatico operates across webstores, marketplaces, warehouse partners, couriers, and payment providers. Every interaction generates raw data. To understand our analytics architecture, it helps to distinguish two key concepts:
1. Data Warehouse (DWH): The physical database storage system where raw and processed data live in one place.
2. Data Layer: The architectural framework and pipeline stages for our DWH (e.g. ODS → DIM/DWD → DWS → ADS).
A structured data layer brings order to the data warehouse by defining clean, standardized stages for transforming raw data into usable dashboards.
In a standard ETL flow, data is transformed before it reaches the warehouse. At Vatico, we first extract and load raw data into the warehouse, then transform it there. This is known as an ELT flow — as shown in the pipeline diagram below.
ELT Pipeline — How raw data becomes usable data
Source Systems
WooCommerce, Marketplaces, CRM, Payment Providers
→
Extract
Pull raw data (JSON, CSV, APIs)
→
Load
Dump into warehouse as-is
→
Transform
Analysts clean & reshape inside DWH
→
Dashboards & Reports
BI tools query clean tables
The Old Data Layer: A Flat, Table-Per-Purpose Design
To move quickly, Vatico adopted a Silicon Valley practice: building a custom table for every specific business question or dashboard. If the CEO needed revenue, a new table was built. If Ops needed shipping stats, another table was created.
Vatico’s Old Flat Data Layer (Conceptual Structure)
Source Data
Raw data dumps from WooCommerce, CRM, Marketplaces, Payment Providers, Logistics APIs.
WooCommerce Marketplace API Payment Provider API CRM Logistics Courier API
WooCommerce Marketplace API Payment Provider API CRM Logistics Courier API
Curated Database
Data analysts write custom SQL / dbt models for every single request, spawning hundreds of ad-hoc tables.
orders_marketplace_cleaned revenue_marketplace_monthly shipment_status_partner …and ~396 more single-purpose tables
orders_marketplace_cleaned revenue_marketplace_monthly shipment_status_partner …and ~396 more single-purpose tables
Dashboards & Reports
BI tools (Metabase, Data Studio) query single-purpose tables directly.
CEO Revenue Dashboard Ops Shipping Report Finance Reconciliation View
CEO Revenue Dashboard Ops Shipping Report Finance Reconciliation View
While this flat approach worked initially, scaling to 400 single-purpose tables created severe friction. Here are the four core problems that forced us to redesign the data layer.
Why Switch the Data Layer?: Four Real Problems
These were not theoretical complaints — they were daily friction points for analysts and interns working in the warehouse.
01
~400 Tables Without a Map
The warehouse grew to 400 single-purpose tables. Without standardized layers, discovering which table was active, up-to-date, or trustworthy took hours of digging.
02
Duplicated & Conflicting Metrics
Because tables were built per-request, common metrics like revenue or shipping costs were transformed differently across tables, causing conflicting numbers for the same question.
03
High Maintenance & Risk at Scale
Every new dashboard required a new dbt model and table. Compute costs surged, and changing one upstream table risked silently breaking downstream models.
04
Operational Visibility Gaps
When ingestion jobs stalled (e.g. data missing for 3+ hours), there was no native, real-time alert. We had to rely on tools to catch failures.
A concrete example — the “which table do I use?” problem
Imagine your manager asks: “How many Sales Orders shipped in April by courier?”
You search the warehouse and find 10 different tables named “sales_order”. Some are legacy, some are incremental, and some use custom filters. You pick one, run the query, and find your number doesn’t match the dashboard — because the dashboard queries a separate table created months ago with slightly different logic.
A 20-minute task takes 3 hours simply navigating table fragmentation.
Why It Made Sense Then vs. Why We Had to Change
Early choices were intentional trade-offs for speed when Vatico was small. But patterns that work for 20 tables create bottleneck friction at 400 tables.
| Early Context | Why It Worked Then | Why It Stalled at Scale |
|---|---|---|
| Small team & ~20 tables | Fast iteration, easy to build per-use-case tables | Grew to ~400 tables; now teams are unclear on which table does what for sure. |
| Silicon Valley startup speed | Answers shipped in a single day | Unregulated table sprawl & duplicated transformation logic |
| No standardized layers | Zero upfront architectural overhead | Costly DataHub mapping ($350/mo) and zero clear data lineage |
~400
Ad-hoc tables with overlapping metrics
$350
Monthly DataHub cost just to map unlayered tables
What the New Architecture Solves
Part 2 introduces our new 5-layer architecture (inspired by Alibaba’s data model): ODS → DIM / DWD → DWS → ADS.
New Architecture Benefits
Reusability
Core metrics (revenue, order volume, shipping SLA) are calculated once in DWS and reused everywhere.
Traceability
Standardized naming and layer rules make lineage obvious from raw ingestion (ODS) down to dashboard outputs (ADS), thus making it easier for AI agents to maintain our database models and tables.
Compute Efficiency
Pre-aggregated ADS tables eliminate heavy repeated queries whenever dashboards refresh.
Native Observability
Structured ODS and DWD layers allow built-in data quality and freshness checks right inside the warehouse.
Key intern takeaway: The goal of a data layer is to build fewer, better-structured layers.
The key benefit we found now with the new layer is that things are much easier to troubleshoot, as we know exactly where the data comes from at each layer — making life not only easier for you as an intern, but for everybody in the company! 😀
End of Part 1
Now that you understand the bottlenecks of our old flat stack, Part 2 breaks down how ODS, DIM, DWD, DWS, and ADS work in practice with real Vatico examples.